Visualization And File Management
Visualization
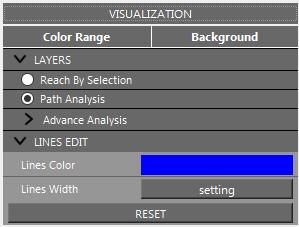
Visualization panel.
The Visualization module controls background color, value color ranges, layer visibility, line color, and line width.
- Color Range
Changes the color ramp for the active numeric attribute.
- Layers
Toggles
Reach by SelectionandPath Analysisoutput layers.- Lines Edit
Applies line color or width settings. Line width can be filtered by a selected numeric attribute.
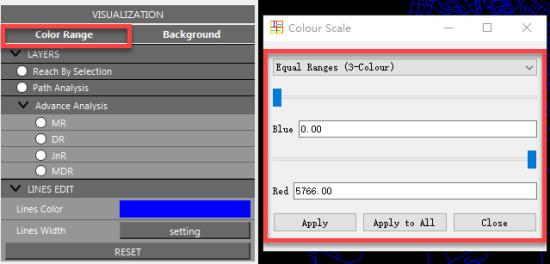
Color range settings.
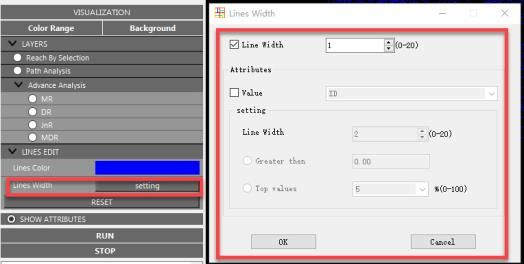
Line width settings.
Use Reset to restore the default visualization state.
File Management
- Open
Opens Shapefile, CSV, or TXT segment-network data.
- Export Analysis
Exports
Interactive ReachorPath Analysisgenerated layers as Shapefile.- Export Screen
Exports the current view as SVG or PNG.
- Export Attributes
Exports selected numeric attributes and segment IDs to TXT or CSV.
For Shapefiles, fields are limited to 10 characters. CSV and TXT outputs use longer field names when possible.