User Interface
UrConnect uses a panel-based layout instead of a menu-heavy workflow. Most actions are grouped into collapsible single-choice panels.
UrConnect Workspace
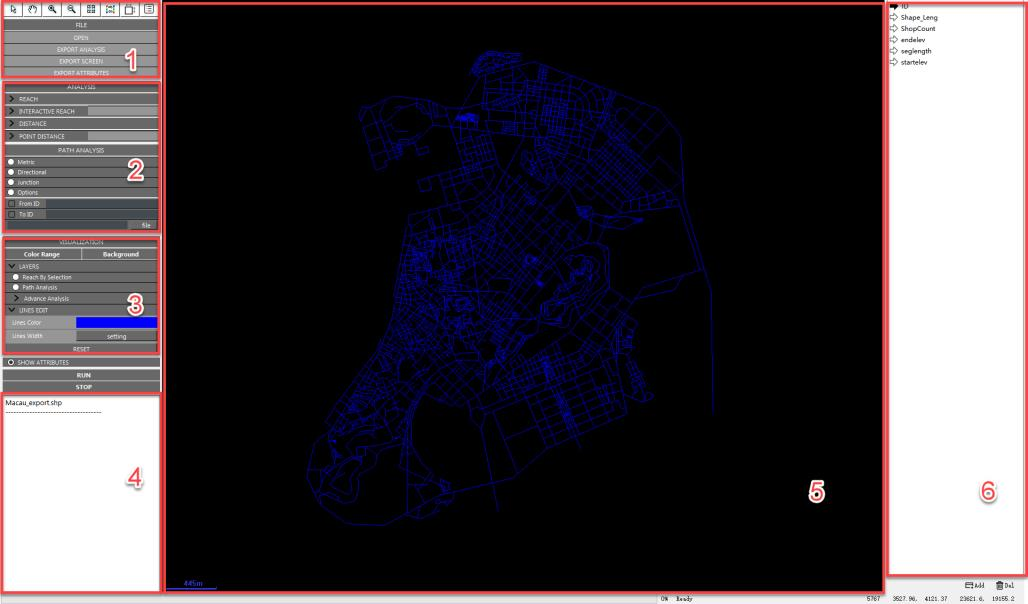
Figure 4.32 UrConnect software interface: 1. tools and data management panel; 2. calculation options and parameter panel; 3. data visualization panel; 4. calculation result summary area; 5. map workspace; 6. map data attribute panel.
Main Areas
- Tool and data panel
Zoom, pan, selection, file opening, screen export, and attribute export.
- Analysis panel
Reach, Interactive Reach, Distance, and Point Distance modules.
- Path Analysis panel
Shortest-path simulation between selected source and destination segments or OD tables.
- Visualization panel
Background, color range, layer visibility, line color, and line width.
- Summary area
File name and temporary analysis summaries.
- Map window
Network display and computed result visualization.
- Attribute panel
Numeric fields from the opened dataset. Text fields are hidden.
Running An Analysis
Select one analysis mode, set its parameters, and click Run at the bottom of the left panel. Use Stop to cancel a long-running calculation.
Showing Attributes
Use Show Attributes to open or close the right attribute panel. Select a numeric field to make it the active visualization field before changing color ranges.